

E. Tinsley, R. Jepras, F. Paul and E. Carter
Analytical Sciences
SmithKline Beecham Pharmaceuticals
Brockham Park, Betchworth
Surrey RH3 7AJ, UK
 email: Robert_Jepras-1@sbphrd.com
Fluorescence and light scattering data showed the presence of sub-populations of cells within
the culture with respect to cell size and B-galactosidase activity. The population with the
largest fluorescence contained the smaller cells, demonstrating that a decrease in cell size,
which indicates the onset of stationary phase, was accompanied by an increase in expression of
rpoS.
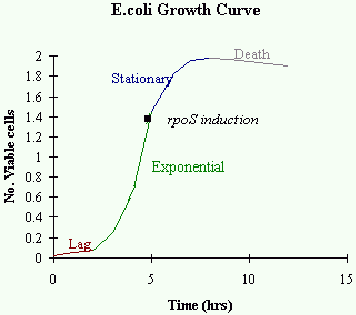
The gene rpoS has been identified as a major regulator of gene expression at stationary phase(1).
Its product, sS, induces the expression of 15-20 genes by an unknown mechanism, including bolA
(a morphogene), katE + xthA (H2O2 resistance), glgB + glgCA (glycogen synthesis), treA
(periplasmic trehalase), dps (DNA protection), and an uncharacterised thermotolerance system.
rpoS itself is negatively controlled by cAMP, synthesis of which is increased at entry into
stationary phase, and may also be inhibited during exponential phase by the histone-like protein
H-NS.
Many complications during bacterial infections are due to stationary phase or dormant bacteria
which resist conventional antibiotic treatments. Entry into stationary phase is controlled by
rpoS, so an attempt to disable this gene and its product sS may render the persistent infection
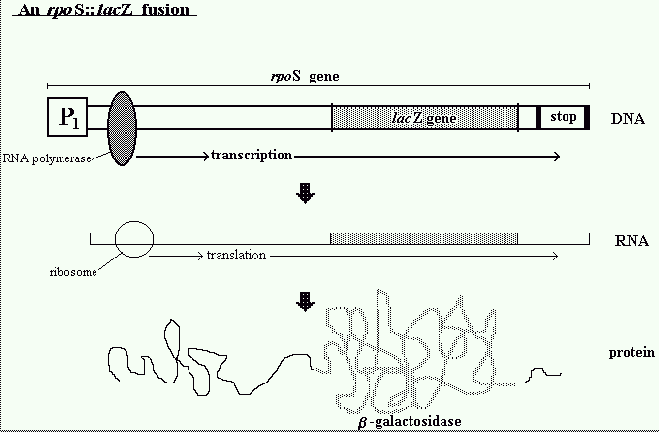
susceptible to treatment. The investigation was designed to study expression of rpoS using a
reporter gene lacZ. The E.coli lacZ gene is important for detecting the expression of recombinant
genes in cells, thus the strain used consisted of an rpoS::lacZ fusion. Traditional methods for
measuring lacZ expression are based on colorimetric assays using o-nitrophenyl-B-D-galactoside,
which gives an average value for rpoS expression for the whole population. In this study the
fluorogenic substrate 5-dodecanoylaminofluoroscein di-D-galactopyranoside (C12FDG) and flow
cytometry were used to analyse the single cell expression and the distribution rpoS expressing
cells within the population. When C12FDG is hydrolysed by intra-cellular B-Galactosidase, a green
fluorescent product is formed and is retained inside the cell. Consequently these fluorescent
cells can be detected using flow cytometry (2).
Assay for B-galactosidase using C12FDG
1ml stock solutions of C12FDG (Molecular Probes. Inc.) were prepared in nutrient broth at a
concentration of 200uM and stored at 4C (stable for 48 hours). The stain was pre-warmed to 37C
before use. 100ul of stock solution was added to each 1ml sample of culture and incubated at 37C
for 90 minutes. Samples were then centrifuged at 12,000 rpm for 2 minutes, supernatant removed and
the pellet resuspended in ice cold 0.2um filtered PBS. They were examined by flow cytometry
immediately. Controls consisted of cells that were prepared in the same way but without
substrate treatment.
Flow cytometry
A Bryte HS (Bio-Rad) flow cytometer was used. Illumination was provided by a 75 W high pressure
mercury-xenon arc lamp. Excitation and emission wavelengths were 470-490 nm and 520-550 nm
respectively. Data was acquired using Bio-Rad WinBryte software and following conversion of
files into FCS format data was handled using WinMdi (version 2.1.1). Forward angle light
scattering (FALS) is defined as the light detected in the angular range of 1-18 degrees, and large
angle light scattering (LALS) is the light detected over an angular range of 18-85 degrees.
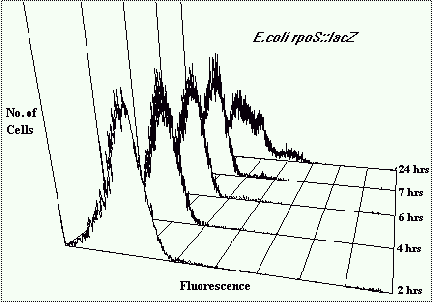
Figure 4 depicts fluorescence histogram overlays of a population of E.coli containing the
rpoS::lacZ fusion gene sampled after 24h of growth. The control histogram represents C12FDG
untreated bacteria. The higher intensity fluorescence histogram represents cells that have
been treated with C12FDG to indicate lacZ expression. The mean fluorescence intensity is
significantly greater indicating b-galactosidase activity. The fluorescence distribution
within the population is broad indicating that it is expressing variable quantities of
b-galactosidase, hence variable rpoS expression. There are three distinct peaks showing
populations of cells with different levels of rpoS expression. 65% have low expression,
27% have medium, and 8% have very high rpoS expression.
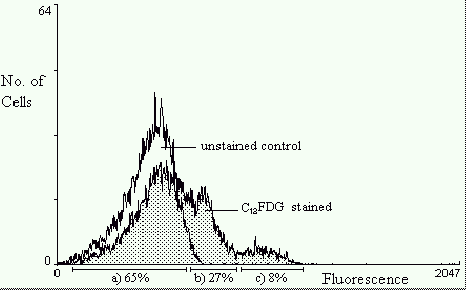
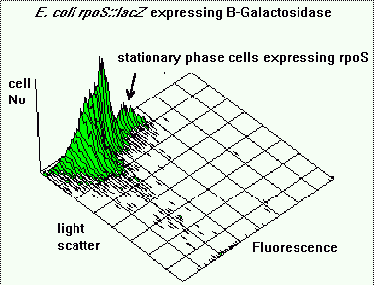
Figure 5 shows an isometric plot of light scattering (cell size) versus fluorescence. It
indicates that the population is heterogeneous with respect to both rpoS expression and cell
size. The sub-population of bacteria with the highest fluorescence intensity correspond to the
smaller cells in the population. Generally E.coli tends to get smaller as they enter stationary
phase. These smaller stationary phase cells also show the highest expression of rpoS.
2) Miao, F., Todd, P., and Komapala, D.S (1993). A single-cell assay of b-Galactosidase in
recombinant Escherichia coli using flow cytometry, Biotechnology and Bioengineering, 42, 708-715.
 Back to Flow Cytometry and Microbiology Introductory Page
