Send suggestions /
questions
Last modified: 12 Nov 1996 15:00 glc
Course
Information
(Pharmacokinetics section of pctx 610)
- Name: Gordon L. Coppoc, DVM, PhD
- Four hours of clnical pharmacokinetics -- Taste only!
Greatly simplified with emphasis on concepts involved.
- For assistance: Office -- Lynn G182
Door Open, come in
Door Closed, make appointment with me before or after
class
- Reference: Harveyetal92 Relevant
parts of Chapter 1 and Chapter 2
Goodman & Gilman's
Pharmacology '96, pp 17-26.?
- Main Goal:
To help you understand major concepts of clinical
pharmacokinetics and to solve simple problems
- These materials on Internet
- On SVM computers, click on "Netscape"
- Then on successive menus in "netscape"
"Schools of Purdue University" -->
"Veterinary Medicine" -->
"Departments" --> "Basic Medical
Sciences" --> "Course Syllabi" -->
"Clinical Pharmacokinetics --PCTX 611 [html]"
- Experimental approach, please give me feedback
Send suggestions /
questions
Last modified: 12 Nov 1996 15:00 glc
- Pharmacokinetics vs pharmacodynamics
- Diagnosis of toxicoses
- Establishing / adjusting dosage regimens
- Understanding withdrawal times for food safety
- Understand terms
- Steady State
- First- & Zero-order kinetics /
Michaelis-Menten plots
- Loading Dose / Volume of Distribution
- Clearance
- Ke (Elimination Rate) & Half-Life
- Bioavailability
- Compartment modeling
- One compartment model
- Two (and more) compartment models
- Adjust dose
- Be able to establish new dose regimens:
- Be able to account for dose forms available
- Be able to predict, at steady state, the Peak and
Trough concentrations
- Timing of samples
- Withdrawal time -- primarily for veterinary students
- Be able to describe significance of withdrawal
times
- Be able to predict theoretical withdrawal time
given key parameters
- Be able to describe effects of changes in dose
regimen on withdrawal time
Send suggestions /
questions
Last modified: 12 Nov 1996 15:00 glc
- Simplest statement
- Predictable relationship between plasma (or
serum) concentration of drug and its effect
- Fancier
- Magnitude of desired clinical response and of
toxicity are functions of the drug concentration
at the site of action and that there is
reasonably predictable relationship between plasma
(or serum) drug concentration and the
concentration at the site of action.
Variability of concentration as function of dose
- [Draw graph of theophylline plasma concentration vs dose
showing large range of variability]
- Contrast to narrower range of effect as function of
plasma concentration
Formula
|
Dosing rate = Clearance * Css
(mg/hr = L//hr * mg/L)
|
- Css = concentration of drug in
plasma at steady state.This works well for IV
infusion. For repeated bolus dosing, the
OSCILLATIONS in concentration that give rise to peaks
and troughs.
- Css(ave) = Average drug
concentration at steady state. Corresponds to the
Css of IV infusion.
- On can replace Css in the
formula above with Css(ave) as a first
approximation
- Css(max) = peak
concentrations at steady state
- Css(min) = trough
concentrations at steady state
|
Simple application
- Draw figure of IV infusion to steady state
- Use data below to establish first plateau
- Draw in desired plateau
- How adjust dose?
- Input data:
- Desired Css = 20 mg/L
- Measured Css = 10 mg/L
- Dose rate = 30 mg/h
- New dose rate = ??
-
New Rate = Old rate * {Desired
Css / Measured Css)
mg/h = mg/h * {(mg/L) / (mg/L)}
|
| 60 mg/h =
30 mg/h * {20/10) |
First- & Zero-Order Kinetics
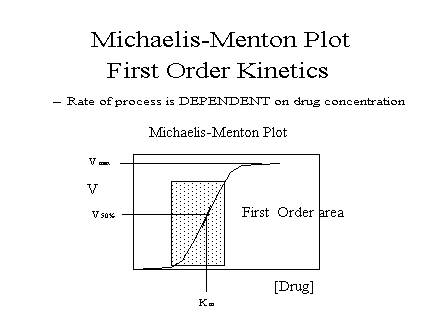
- Michaelis-Menten plot
- One MUST UNDERSTAND the significance of first- and
zero-order kinetics
- In THIS SHORT TREATMENT of pharmacokinetics, we will deal
ONLY with drugs at concentrations where they are
eliminated by FIRST ORDER kinetics
-
 |
Note:
* Upper flat portion is the zero-order portion
* velocity is in mass/time (NOT fraction);
* Drug concentration is in mass/volume |
Send suggestions /
questions
Last modified: 12 Nov 1996 15:00 glc
Send suggestions /
questions
Last modified: 12 Nov 1996 15:00 glc
FICTITIOUS CASE and DRUG
Date: 5/16/95
Name: Susie
Signalment: Female, 11 yrs
History: Seizures started 12/94. Medications started 4/95.
Chemistry panel normal
Current Status: No seizures since started current dose
regimen
Dose: 12 mg (elixir), PO Dose Interval: 12 h
Time on Dose:3 weeks
Serum Concentration #1: 20.2 mcg/mL @ 2 h #2: 19.9
mcg/mL @ 12 h
- Plot data from case on arithmetic graph paper
- make "y" axis 0 to 50 (mcg/mL serum)
- make "x" axis 0 to 14 (hours)
- Plot 2 hr concentration = 20.2 mcg/mL
- Plot 12 hr concentration = 19.9 mcg/mL
- What fluid was measured? Why?
- How were sample times chosen?
- Does the concentration change much during the dose
interval?
- During this dose interval, will the concentration more
than likely go | higher
| lower
| than the reported values?
- What might the "curve" look like if one had all
the data?
Draw a light dotted line representing your
notion of the curve's shape
- Given the two concentrations and sample times, predict
whether this drug is eliminated |
rapidly or slowly |.
- [scan ] What you should
have produced
- [drawing][scan] Graph of phenobarbital
concentration versus time
(scan is figure 1, Ravis et al, AJVR
45:1283-1286, 1984)
- The concentration is approximately 20.2 ug/mL at 2 hours
... So what?
- The concentration is approximately 19.9 ... So what?
- How does serum/plasma drug concentration relate to
effect?
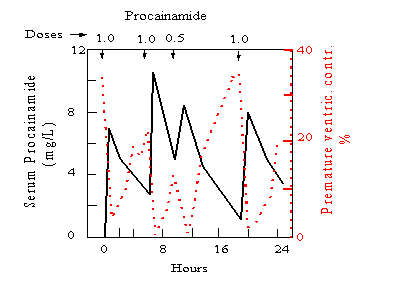
- Procainamide
concentration vs effect (Koch-Weser73: , 5th
Int. Cong. Pharmacol. Pharmacology and Future of Man.
Problems of Therapy, Vol. 3, 1973)
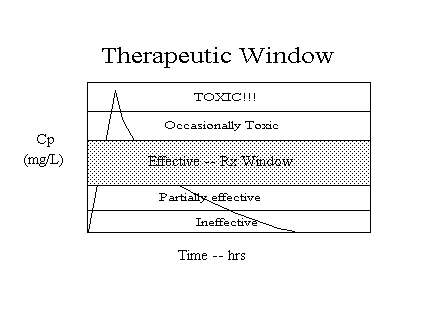
- Draw two heavy horizontal lines across graph --
one at 20 ug/mL -- Label it Minimum Effective
Concentration (MEC)
one at 40 ug/mL -- Label it Minimum Toxic
Concentration (MTC)
- Write "often toxic" above the 40 ug/mL line
- Write "insufficient effect" below the 20 ug/mL
line
- What name might one give to the "middle" area
of the graph?
- How might one establish the "minimum toxic" and
"minimum effective" concentrations?
- Are these concentrations "absolute"?
- Look at the observed concentrations in this case
vis-a-vis the therapeutic window you have made
- Note that the "Susie" has not had seizures for
3 weeks
- Should one change the dose and/or schedule for Susie?
- Why or why not?
Send suggestions /
questions
Last modified: 12 Nov 1996 15:00 glc
Date: 5/24/95
Name: John Doe
Signalment: male, 50 kg
History: Weak, transfusion 5/23/95
Current Status:improving
Dose: 4 mg/kg IV Dose Interval: 8 h
Time on Dose:since 5/22/95 at 8 PM
Serum Concentration #1: 5.0 mcg/mL @ 1 h #2: 0.9
mcg/mL @ 8 h
- Plot data from case on arithmetic graph paper
- make "y" axis 0 to 20 (mcg/mL serum)
- make "x" axis 0 to 14 (hours)
- Plot concentration #1 (5.0 mcg/mL @ 1 h)
- Plot concentration #2 (0.9 mcg/mL @ 8h )
- Is this the highest the concentration is likely to be (or
have been) during this dose interval?
- Will the concentration go lower during this dose
interval?
- Draw your idea of what might the "curve" look
like if one had all the data?
- Does the concentration change much during the dose
interval?
- What does this change indicate about the "rate of
elimination" -- fast? slow?
Note contrast relative to anticonvulsant example
- Is this a first time dose? Can one tell?
- How were sample times probably chosen?
- What fluid was measured? Why?
- The concentration is approximately 5 mcg/mL @ 1 hour, ...
So what?
- The concentration is approximately 0.88 mcg/mL @ 8 hours,
... So what?
- How does the ratio of trough to peak compare to that in
the anticonvulsant example?
- Draw horizontal lines across graph at --
- 12 mcg/mL
- 5 mcg/mL
- 1 mcg/mL
- Write "often toxic" above the 12 mcg/mL line,
the MTC
- Write "insufficient effect" below the 5 mcg/mL
line, the MEC
- Write "need to drop below" below the 1 mcg/mL
line, (another MTC?)
- Where is the therapeutic window in this graph?
- What is the meaning of the "need to drop below"
statement
- How might his relate to toxicity of gentamicin
- Are these concentrations "absolute"?
- Note: this is the traditional understanding of ideal
gentamicin dosage regimens. New concepts will be
presented in the chemotherapeutic section.
- Look at the observed concentrations in this case
vis-a-vis the therapeutic window
- Note that the Mr. Doe was said to be
"improving" -- What does this mean for advising
physician?
- Should one change the dose and/or schedule for Mr. Doe?
- Why or why not?
Send suggestions /
questions
Last modified: 12 Nov 1996 15:00 glc
- Primary hypothesis of target concentration strategies
- Why we use plasma/serum for sampling
- Drug concentration (C) vs Time (t) plots -- proper
graphing
- Minimum Effective Concentration (MEC)
- Minimum Toxic Concentration (MTC)
(added concept of "need" to have low trough in
some cases)
- Therapeutic Window; Target Concentration Range
(related concept of "Therapeutic Index")
- Dosage adjustment -- simple cases --> Simple
proportion
- Assumptions for "simple" dose adjustment
- Dose interval (T) stays same
- No significant change in animal's handling of the
drug
- Kinetic processes not dose dependent
- Need to pay attention to whether it is peak or trough
that you are adjusting!
- Importance of need for knowing "peak" and
"trough" concentrations depends on the drug
New concept: OSCILLATION during dosage interval (more
later)
- Best times to take samples
Send suggestions /
questions
Last modified: 12 Nov 1996 15:00 glc
Send suggestions /
questions
Last modified: 12 Nov 1996 15:00 glc


