Clinical Pharmacokinetics, Part 1
G.L. Coppoc
Contents
- Overview
- Uses of clinical pharmacokinetics
- Need for therapeutic drug monitoring (TDM)
- Relation between effect and serum drug concentration
- Fundamental hypothesis of pharmacokinetics and Toxicokinetics
- Therapeutic window
- Major pharmacokinectic compartments
- Use TDM for what kind of drugs
- Inter-individual variation
- Important pharmacokinetic variables
- Michaelis-Menton plot (Zero and First Order kinetics)
- Half-life defined on plot
- Clearance (CL) and Ke
- Volume of distribution (VD)
- Bioavailability
- IV Infusion - steady state
- Dose adjustment
- Loading dose
- One compartment model
- Two compartment model
Overview
- Why need "pharmacokinetics" and some general principles
- Important pharmacokinetic variables
- IV Constant Infusion
- Bolus & Multi-dose Regimens
- Two Major Approaches to Pharmacokinetic Analysis (Compartment
models)


Why Need Pharmacokinetics and Some General Principles
Uses of Clinical Pharmacokinetics
- Therapeutic drug monitoring
- Toxicity
- Assess drug reactions
- Diagnose toxicities
Need for TDM
(Therapeutic Drug Monitoring)
- Optimize/individualize dosage
- Titration using measurement and computation to reduce "trial
& error" approach
- Check for Compliance
- Only 44% compliance in TB patients
- Less than 60% in hypertensive patients
Relation Between Effect and Serum Drug Concentration
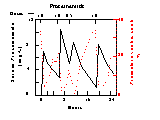
- Drug = Procainamide hydrochloride, an antiarrhythmic drug
- Effect = Premature ventricular contractions in human
- Note close correlation
- Koch-Weser, 5th Int. Congr. Pcol & Future of Man
Procainamide
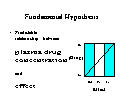
Fundamental Hypothesis
- Predictable relationship between
plasma drug concentration
and
effect
Therapeutic Window
Major Pharmacokinetic Compartments
Use TDM for What Kinds of Drugs?
- Drugs with
- Narrow safety margins
- Effects not immediately obvious
- Large inter-individual differences in pharmacokinetics
Inter-individual Variation
- Differences among individuals are greater for--
- Dose --> Plasma drug concentration
- Than for --
- Plasma drug concentration --> Effect
Important Pharmacokinetic Variables
Important Pharmacokinetic Variables
- First and Zero-order Kinetics (Michaelis-Menton plots)
- Half-life and Ke
- Clearance (CL)
- Volume of Distribution (Vd)
- Bioavailability (F)
- AUC (Area Under the Curve)
Michaelis-Menton Plot
First Order Kinetics
Michaelis-Menton Plot
Zero Order Kinetics
Half-life -- Defined on Plot
Clearance (CL) Usefulness
- CL is a measure of the rate at which drug is eliminated from
the body
- It reflects function of organ(s) of elimination
Clearance Defined
- Definition
- Virtual volume of measured body fluid (usually plasma) completely
freed of drug per unit of time
- CLB = Sum of all clearances
- CL(body) = CL(renal) + CL(liver) + ...
Extraction Ratio
Relating ER, CL, & Ke
- ER = constant if Flow, Vd, and renal function are constant.
- CL = Volume cleansed/min = 25 ml/min
- If 0.5 of drug is removed and flow is 50 ml/min, then is equivalent
to removing 100% of drug from 25 ml/min
- Ke = CL / Vd
- i.e., Fraction of Vd cleansed/min
- Note that this corresponds to fraction of drug removed/min!!!
Extraction Rate Limited vs.
Flow Rate Limited CL
- For Some Drugs changes in --
- Organ function change CL very little
- blood flow rates change CL much
- For Other Drugs changes in --
- Organ function change CL much
- Blood flow change CL very little
- For Still Others, changes in --
- Both change CL significantly
Clearance and Ke
- CL= virtual volume of plasma completely freed
of drug per unit time, (e.g., L/hr)
- Ke = Fraction of Vd cleansed of drug per unit
time and Fraction of drug removed
per unit time (not shown here!) (e.g., n/hr )
- Note: Same terms are in both equations
Clearance -- Tidbits
- CL = constant when plasma drug concentration ([drug]p) is
less than that which "saturates" the elimination system(s)
- CL = variable when [drug]p is at or near the Vmax of elimination
process(es)
- CL often changes with disease and stage of disease
Volume of Distribution (Vd) Usefulness
- The major usefulness of Vd is as a variable in pharmacokinetic
computations
- Vd has no anatomic correlate
- Vd assumes drug is uniformly distributed throughout the volume
indicated. This assumption is seldom warranted
Volume of Distribution (Vd) Definition
Vd -- Tidbits
- Virtual space
- not specifically identifiable as an anatomic space
- Does not imply equal drug concentration throughout the body
- Changes with --
- physiologic status, e.g., pregnancy
- disease and disease state, e.g., changes in protein binding
Vd -- Types
- Vd(extrap)
- extrapolated from plot of Cp vs time
- Vd(ss)
- Others
- Don't all give the same answer. Tendency today is to use Vd(ss)
where possible
Determining Vd(extrap)
- Fluid measure usually plasma
- Usually measure TOTAL DRUG
- Measuring FREE DRUG better, but not perfect indicator of drug
at site of action
- May exceed Total Body Water!
Bioavailability (F) -- Usefulness
- Bioavailability (F) is multiplied by the dose given to determine
the TRUE DOSE
- It accounts for loss prior to drug reaching the central circulation
Bioavailability (F) -- Definition
- Definition
- Fraction of administered drug that reaches the
systemic circulation
- Dose calculation example
- Recommended dose = 20 mg/Kg
- F = 0.5
- True dose = Recommended dose / F
- True dose = (20 mg/Kg) / 0.5 = 40 mg/Kg
Bioavailability (F) -- Tidbits
- Use systemic circulation because --
- it is EASY to sample
- it is in contact with all body tissues
- Not 100% because of drug loss through --
- elimination prior to reaching central systemic plasma
- Binding of drug to tissue components thus preventing absorption
Bioavailability (F) -- Sites of Loss
- Example -- PO Adm.
- Penicillin G, 1000 IU
- 90% destroyed in stomach so only 10% reaches systemic circulation
- Other drugs
- propranolol -- extensive inactivation in liver
Bioavailability (F) -- Determination
- Look-up in reference
- Measure: Compare exposure by desired route to IV, which
is defined as 1.0.
- Exposure i.e., integral of drug concentration and time
plot (AUC)
IV Constant Infusion
IV Infusion to Steady State
"Accumulation"
- IV infusion at constant rate causes drug concentration to
rise until it plateaus at the steady state
- Css = Concentration of drug at steady state plateau
IV Infusion
Time To Steady State
- Time to reach steady state concentration during constant IV
infusion is determined by elimination rate!
- Examples
- 50% Css = 1 half-life
- 75% Css = 2 half-lives
- 87.5% Css = 3 half-lives
- 93.75% Css = 4 half-lives
- 96.87% Css = 5 half-lives
IV Infusion -- Initial Dose Rate
- Look up values in literature
- Population (desired / predicted) values
- Css = 30 mg/L
- CL = 0.33 L/hr
- Predicted DR = Css x CL
- 30 mg/L x 0.33 L/hr = 10 mg/hr
IV Infusion -- Adjust Dose
- Initial Dose Rate
- Css
- Measured = 20 mg/L
- Desired = 30 mg/L
- Use simple proportion
- New Dose Rate = Initial Rate * (Desired Css / Measured Css)
- New Infusion Rate = 15 mg/hr
IV Infusion -- Adjust Dose
Estimate Patient's CL from data?
- Infused 10 mg/hr and produced 20 mg/L concentration in plasma
- CL = DR / Css
- (10 mg/hr) / (20 mg/L) = 0.5 L/hr
IV Infusion -- Dose Adjustment Complications
- Real life slightly more complicated than the example
- Must account for
- Formula weight of drug as supplied vs the Molecular weight
of drug as measured
- May need to give "loading dose" to produce concentration
equivalent to Css faster
Load Dose -- Simple Approach
- Needed population/literature estimates
- Css(desired)
- Vd (note if is for "std 70 kg person" or "per
kg"
- Loading dose = Css(desired) * Vd(predicted)
- In earlier example --
- Css(desired) = 30 mg/L & Vd(predicted) = 21L:
- Dose(loading) (mg) = Css (mg/L) * Vd (L)
- Dose(loading) = 630 mg
-----------------------------------------------------------------------------------------------
Bolus
&
Multi-Dose Regimens
Multi-Dose Regimens --
Additional Considerations
Two Major Approaches To Pharmacokinetics
- Model Dependent
- One compartment model
- Two compartment model
- Three compartment model
- etc.
- Model Independent
- Dosing rate = Clearance * Css
One Compartment Model -- Diagram
One Compartment Model -- Assumptions
- Instant mixing in body (relative to other process rates and
time of first measurement of drug concentration)
One Compartment Model -- Plot
Cp(t) = A * e-(Ke * t)
One Compartment Model -- Formula
- A = 0-time intercept of line drawn through data points
- Ke = negative slope of line
- t = time elapsed
- e = base of natural logs
- Cp(t) = Plasma drug concentration at time = "t"
Two Compartment Model -- Diagram
Two-Compartment Model Assumptions
- Instant mixing in each compartment (relative to other process
rates and frequency of measurement)
- Input and output from central compartment
Two Compartment Model -- Plot
Two Compartment Model -- Formula
Cp(t) = A * e-(a * t) + B * e-(b * t)
Multi-Dose -- Similarities to Constant Infusion
Multi-Dose Adjust -- Css(ave)
Multi-Dose -- Use Which Css??
Css(min)!
Multi-Dose Adjust -- What about the Peak?
- If peak concentration is too high, could produce toxicity
- Must be concerned about degree of oscillation in dose schedule
- If route is other than IV, the degree of oscillation will
always be less than predicted by calculation of Css(max) and (min)
Effect of Regimen on Oscillation
- If dose interval (T) = elimination half-life, then
Peak is 2x Trough!
- Increased T, increases oscillation
- Decreased T, decreases oscillation toward that of IV infusion.
- Calculation of oscillation requires ability to estimate peak
and trough at SS.
Estimation of Css(max) -- PEAK
- Css(max) = (F*D/Vd) * { 1 / [1- e(-Ke * T) ] }
- Note similarity to --
Cp(t) = Cp(0) * Accumulation factor
- Terms:
- F = Bioavailability Vd = vol distr. (L)
- D = Dose (mg) T = Dose interval (hr)
- Ke = Elimination rate (1/hr) e= base natural log
Estimating Css(min)
- First estimate Css(max) using appropriate equation
Then use old standby for predicting Cp(t), but now "t"
is defined as "T", the dose interval.
Css(min) = Css(max) * e(-ke * T)
- Similar to --
Cp(t) = Cp(0) * e(-ke * t)
Determining Dose Interval (T)
- Refer to literature recommendations
- Make "T" something easy for patient / staff to comply
with, e.g., q1d, q12h, q8h, q6h
- Keep "T" as long as possible consistent with reasonable
oscillation
- Do multiple computations of Peak and Trough with various "Doses"
and "T" to obtain appropriate regimen
- First recommendations will be close to literature values,
but after have "MEASURED" Cp from patient, may be very
different
Determining Dose Rate for Oral Dose forms, e.g., Tablets
- Using liquid dose forms has theoretical advantage of allowing
"continuously variable" dosing.
- In practice, this is true only for injections
- For oral dose forms, nearly always some step function, e.g.,
teaspoon, tablespoon, for liquids
- For tablets, manufacturers prepare range of weights appropriate
for most patients, e.g., 5 mg, 25 mg, 50 mg, 100 mg, etc.
- NOTE: In many cases, the drug is a small percentage of a tablets
weight
Sample Calculation using Theophylline for Asthmatic
- Patient
- Drug
- Pharmacokinetic data
- IV Infusion
- Oral Dosage Regimen
- Oscillation
- Loading Dose
Multi-Dose


