A Strategy for B Cell Minimal Residual Disease Detection
Paula I. Fukushima, Gregory Jasper and Maryalice Stetler-Stevenson
Flow Cytometry Unit, Laboratory of Pathology, National Cancer Institute, National Institutes of Health, Bethesda, Maryland
Analysis of light chain expression is an important determination in the flow cytometric immunophenotyping of patient specimens. Numerous factors impact a laboratory’s ability to detect light chains including choice of appropriate antibodies, non-specific binding and tumor burden. When examining specimens for minimal residual disease, strategies are needed to acquire sufficient B cells to gain statistical significance.
One strategy is to perform a B-cell acquisition where one gate is drawn around the B cells and another around the lymphocytes. Cells that meet both criteria are acquired. This method gives good results, but requires setting up extra tubes and analysis is time-consuming. Another strategy requires acquisition of large numbers of events. Faced with problems in storage and analysis of large files, this strategy has not been feasible. However, with the development of more powerful computers and greater storage capacities, we determined the collection of large numbers of events gives similar results to B-cell acquisition.
Method:
A patient specimen was stained with a panel of antibodies to detect neoplasia. The patient has a history of lymphoma expressing lambda light chains. Within a larger panel, two sets of light chain reagents were paired: Biosource International reagents(diluted 1:15, 10il per test) with anti-CD19(20ul per test) and Sanofi, Inc. reagents(diluted 1:15, 10ul per test) with anti-CD20(10ul per test).
| Reagent
| Source
|
| Polyclonal kappa FITC
|
|
| Polyclonal lambda FITC
| Biosource International(Tago), Camarillo, CA
|
| Polyclonal kappa FITC
|
|
| Polyclonal lambda FITC
| Sanofi Inc.(Kall), Chaska, MN
|
| CD19 PE
| Becton-Dickinson, San Jose, CA
|
| CD20 PE
| Dako Corp., Carpeteria, CA
|
Briefly, instead of live gating, a light chain/CD19 PE tube(the CD20 tubes were not used as CD20 is present on monocytes) was run and 10,000 events collected. The percent of B cells was determined and total number of events needed to collect 3,000 CD19 positive events calculated. Light chain/B cell tubes were acquired, collecting a total of 3,000 B cells.

|
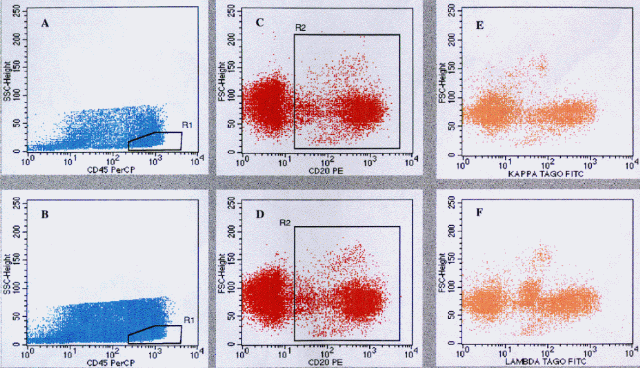
A. CD45 versus SSC showing 20% of events collected. neutrophils not acquired. R1 region set on
lymphocytes. B. Same as in A, showing 100% of events collected. CD20 PE versus FSC through R1 in A.
R2 region set on CD20 PE positive events. D. Same as in C. E. Kappa (TAGO) FITC versus FSC gated
through R1 and R2 (R2*R1). F. Lambda (TAGO) FITC versus FSC, gated through R1 and R2, showing abnormal
dim lambda positive and increased FSC population.
|
If you have CellQuest software, you can view additional files contained in the 10/data/bcell directory
on this CD-ROM.
Back to clinical immunophenotyping
CD-ROM Vol 3 was produced by Monica M. Shively
and other staff at the Purdue University Cytometry Laboratories
and distributed free of charge as an educational service to the
cytometry community. If you have any comments please direct them
to Dr. J. Paul Robinson, Professor & Director, PUCL, Purdue
University, West Lafayette, IN 47907. Phone:(765) 494-0757; FAX
(765) 494-0517; Web http://www.cyto.purdue.edu,
EMAIL cdrom3@flowcyt.cyto.purdue.edu


