
|
|
|
ModFit LT contains two systems to evaluate confidence in the S-phase estimates it computes. The first method evaluates several histogram features that have been published as affecting S-phase accuracy (Cytometry. Vol. 14. Number 5, 1993.): %CV, Cell Number and %B.A.D. The Prouts Neck DNA Consensus Conference published a set of guidelines for these histogram attributes and ModFit LT uses these published guidelines to provide you with a graphical and quantitative picture of how the histogram satisfies the requirements.ModFit LT 2.0
ModFit LT evaluates an additional feature not covered by the Consensus Conference: Reduced Chi-Square (RCS). RCS is a measure of how well the model fitted the data. Based on VSH’s experience with RCS values, we added our own guidelines for this feature.
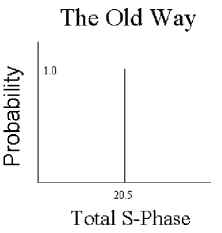
The second method of S-phase assessment is unique to ModFit LT and is based on a statistical approach to the problem rather than a consensus of experiences. By using established statistical methods, ModFit LT calculates the error probability distribution for each of its S-phase estimates (e.g. Total or Average S, Aneuploid S, and Diploid S). The standard deviation of this probability distribution provides a direct quantifiable way of evaluating the confidence of a given S-phase estimate. Let's examine four graphs to make it crystal clear how this system works. The first graph demonstrates how cell cycle programs used to work.

Let’s say that your old cell cycle program gave you a Total S-phase estimate, also known as “Average S-phase”, of 20.5%. Since the program did not give you any information on the variability associated with this estimate, you had to assume that it was correct. Another way of saying the same thing is that the probability of the Total S-phase being 20.5% was assumed to be one. Largely because of this limitation, a number of S-phase criteria have been used to help obtain accurate S-phase estimates (cell number>10,000, %CV<8.0, etc).
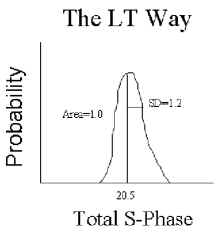
ModFit LT has an exclusive statistical method of estimating the probability distribution about each of its S-phase estimates. Let’s take a look at how that changes our figure.

Since ModFit LT calculates the probability distribution about its estimate, you now have a way of quantifying the S-phase estimate’s variability with a standard deviation. Rather than 20.5% in this example, you now know that it is really 20.5% plus or minus 1.2%.
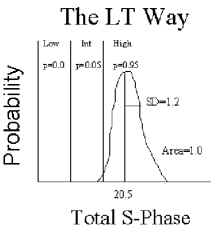
However, ModFit LT takes this S-phase assessment one step further. By evaluating S-phase cutoffs against this probability distribution, the program can calculate the probability of the estimate being in a particular category (e.g. Low, Intermediate, or High). Let’s look at the next graph to see how this works.

The areas of the probability distribution between each of the S-phase cutoffs indicates how likely the S-phase estimate is within that category. For example, the area of the High category is 0.95; thus, there is a 95% chance that the specimen has a high S-phase with your laboratory’s specific S-phase cutoffs. Normally in statistics, you express the probability of the hypothesis not being correct (p-value). In this case, the p-value is simply 1.0 - 0.95, or 0.05, and it is the p-value which ModFit LT displays.
That’s just about all there is to it. Not only does ModFit LT indicate the variability of its estimate, but it also merges your S-phase cutoffs with the derived probability distribution to provide you with just the information you need to convey to the physician about the proliferative activity of the specimen. Is the S-phase high? How sure are you of this assessment? You can now answer both questions quantitatively.
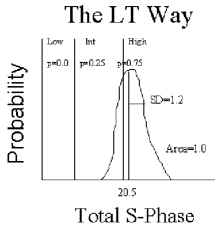
We promised you four graphs and have only shown three so far. Suppose the derived S-phase estimate was one of those borderline calls. It overlaps one of your S-phase cutoffs. Let’s modify the above graph to show that situation.

How do you classify this specimen? If you choose High, then you have a 25% chance of being wrong. When confronted with this situation it’s best to combine two categories. By calling the specimen "Intermediate to High" the probability of being wrong is back to a reasonable level. What you are really saying is that the S-phase is probably not Low.
If ModFit LT determines that the certainty (probability) of a particular S-phase level is less than 0.9, it will automatically combine the two most probable categories. If the certainty is still less than 0.9 with the combined categories, then it indicates this undesirable situation with “?” next to appropriate S-phase assessment.
ModFit LT enables the inspection of the error distributions about each of its S-phase estimates. If the sample is DNA diploid, only the diploid S-phase error distribution can be evaluated. If the sample is DNA aneuploid or tetraploid, only the aneuploid and total S-phase error distributions can be evaluated.
With this new means of evaluating the reliability of S-phase estimates, ModFit LT provides the most sophisticated and objective methods for DNA analysis.
For more information on ModFit LT, contact Verity Software House, Inc. by mail at PO Box 247, Topsham, Maine 04086, USA, by phone at (207) 729-6767, or by FAX at (207) 729 5443.
Go to ModFit LT 2.0 Page
Go to ModFit LT 2.0 Data Sheet
Go to Proliferation Page
Go to Synchronized Cell Analysis Page
For research use only. Not for use in therapeutic and diagnostic procedures
 |
 |
 |
 |